Findings and conclusions
In each County Views survey, we ask for people’s perceptions of the council in five main areas. The data in this report contains the trends for the new set of questions which we reviewed and changed in November 2022.
In the winter survey we received the following results:
- Being well informed about our service
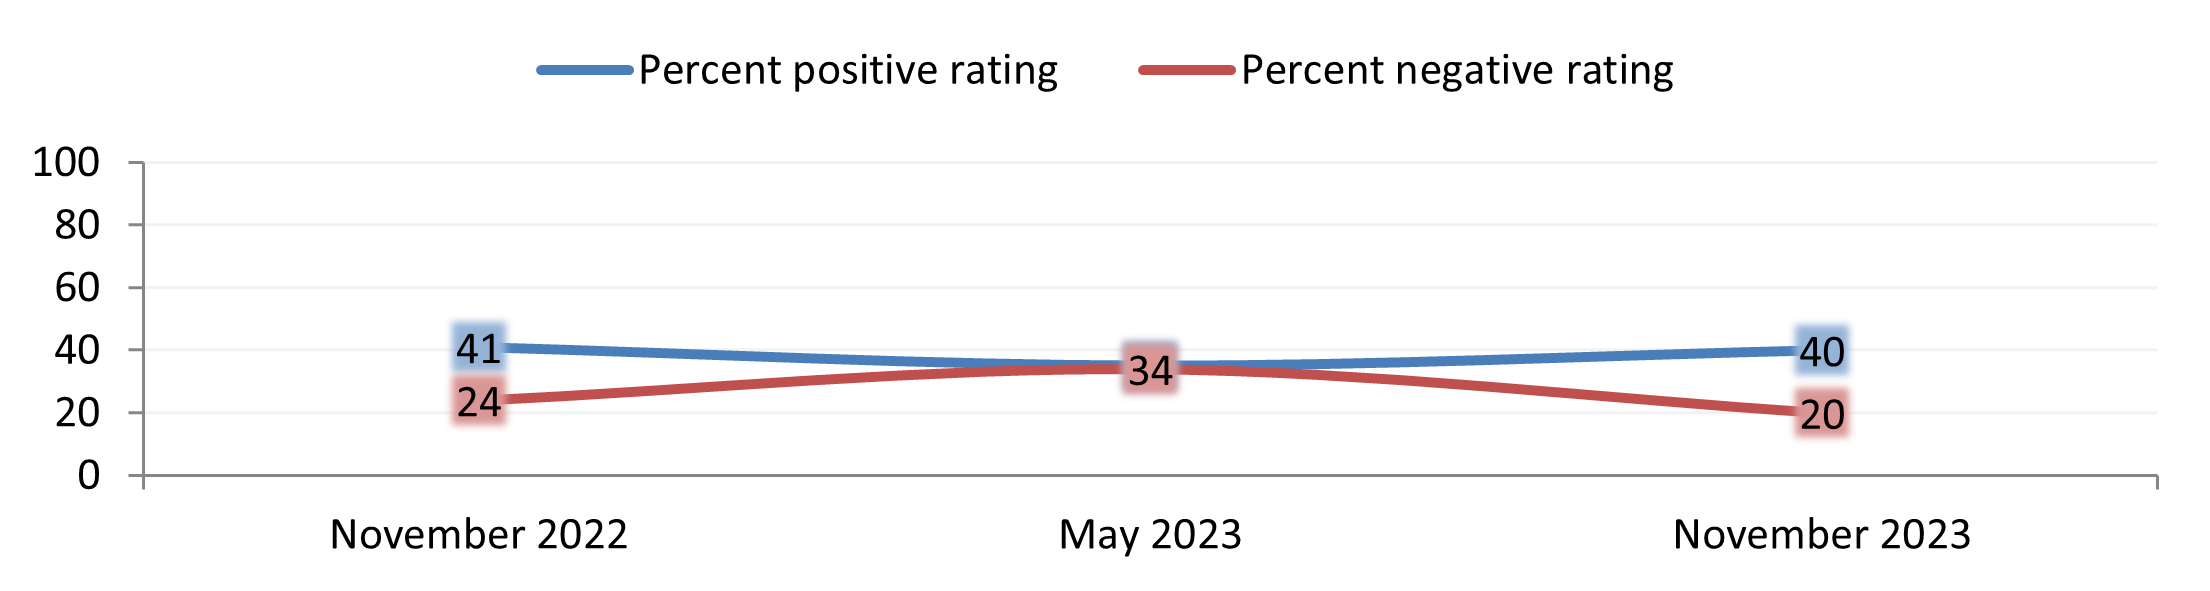
The percentage of people being very well or well informed about our service has risen from the last survey from 35% to 40%. The percentage of people being not well or not at all informed has fallen 34% to 20%.
- Listening and acting on resident’s concerns
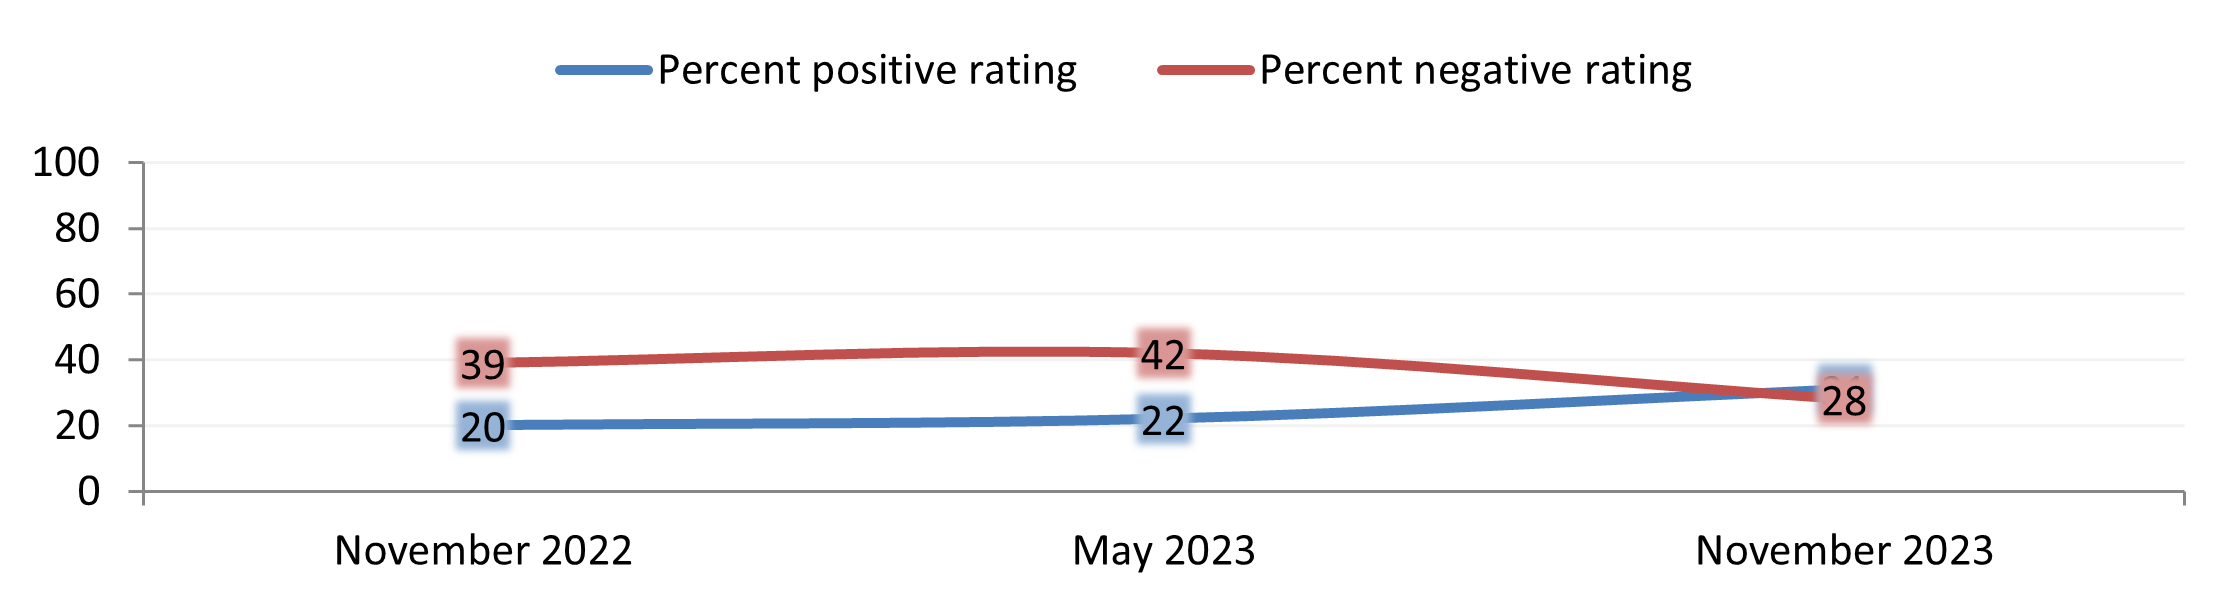
The percentage of people who said we listen and act on resident’s concerns very much so or fairly much so has risen from the last survey from 22% to 31%. The percentage of people who said we do not do much or at all listen or act on resident’s concerns has fallen from 42% to 28%.
- Providing value for money
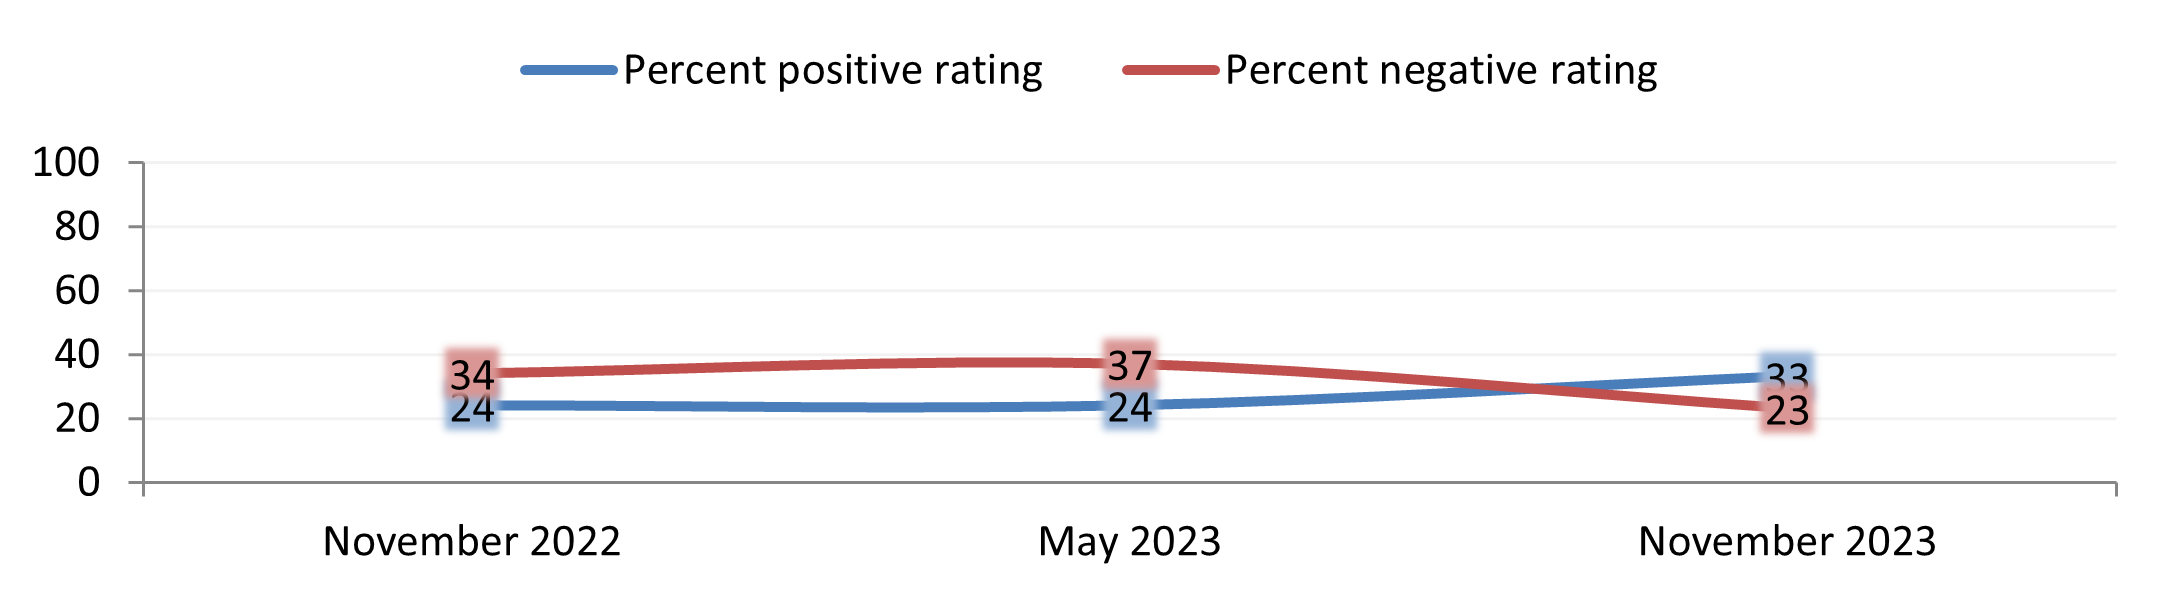
The percentage of people who said we provide value for money very well or well has risen from 24% to 33%. The percentage of people who said we do not provide value for money well or at all has fallen from 37% to 23%.
- Trusting the council
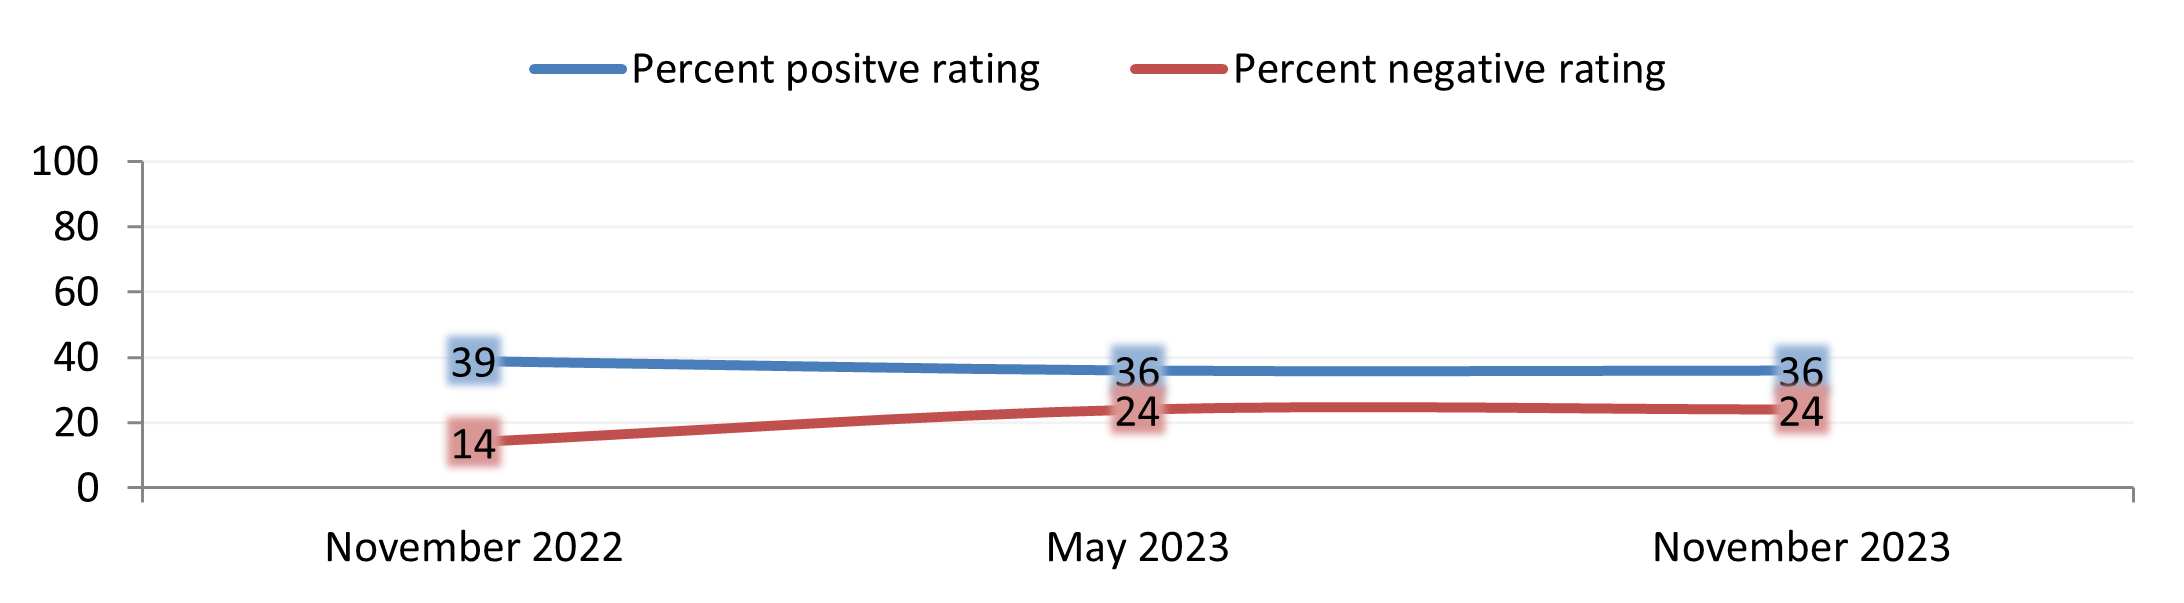
The percentage of people who said we were very trustworthy or trustworthy as a council has stayed the same from the last survey: 36%. The percentage of people who said we were untrustworthy or very untrustworthy as a council has the same from the last survey: 24%.
- Overall satisfaction with the council
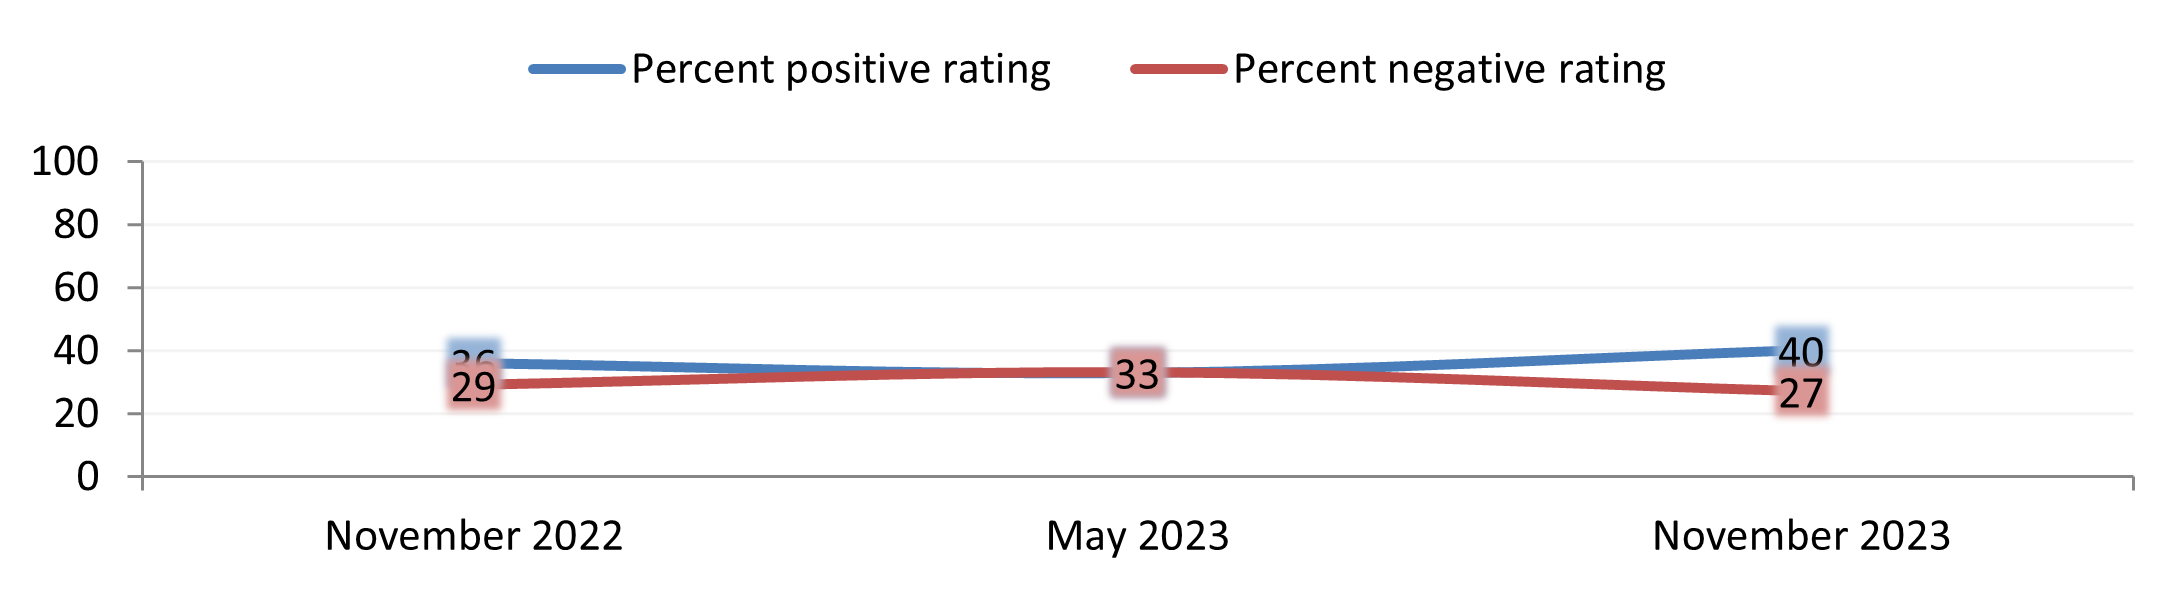
The percentage of people who said they were very satisfied or satisfied with Lincolnshire County Council overall has risen from the last survey from 33% to 40%. The percentage of people who said they were dissatisfied or very dissatisfied with Lincolnshire County Council overall has fallen from 33% to 27%.
To view the survey results in more detail please visit our County Views report page. Here you can see the Power BI report which shows further data in graphs and charts.